Note
Click here to download the full example code
Creating a 3D perspective image
Create 3-D perspective image or surface mesh from a grid
using pygmt.Figure.grdview.
Note
This tutorial assumes the use of a Python notebook, such as IPython or Jupyter Notebook.
To see the figures while using a Python script instead, use
fig.show(method="external) to display the figure in the default PDF viewer.
To save the figure, use fig.savefig("figname.pdf") where "figname.pdf"
is the desired name and file extension for the saved figure.
import pygmt

# Load sample earth relief data
grid = pygmt.datasets.load_earth_relief(resolution="05m", region=[-108, -103, 35, 40])
Out:
grdblend [NOTICE]: Remote data courtesy of GMT data server OCEANIA [https://oceania.generic-mapping-tools.org]
grdblend [NOTICE]: Earth Relief at 5x5 arc minutes from Gaussian Cartesian filtering (9 km fullwidth) of SRTM15+V2.1 [Tozer et al., 2019].
grdblend [NOTICE]:   -> Download 180x180 degree grid tile (earth_relief_05m_p): S90W180
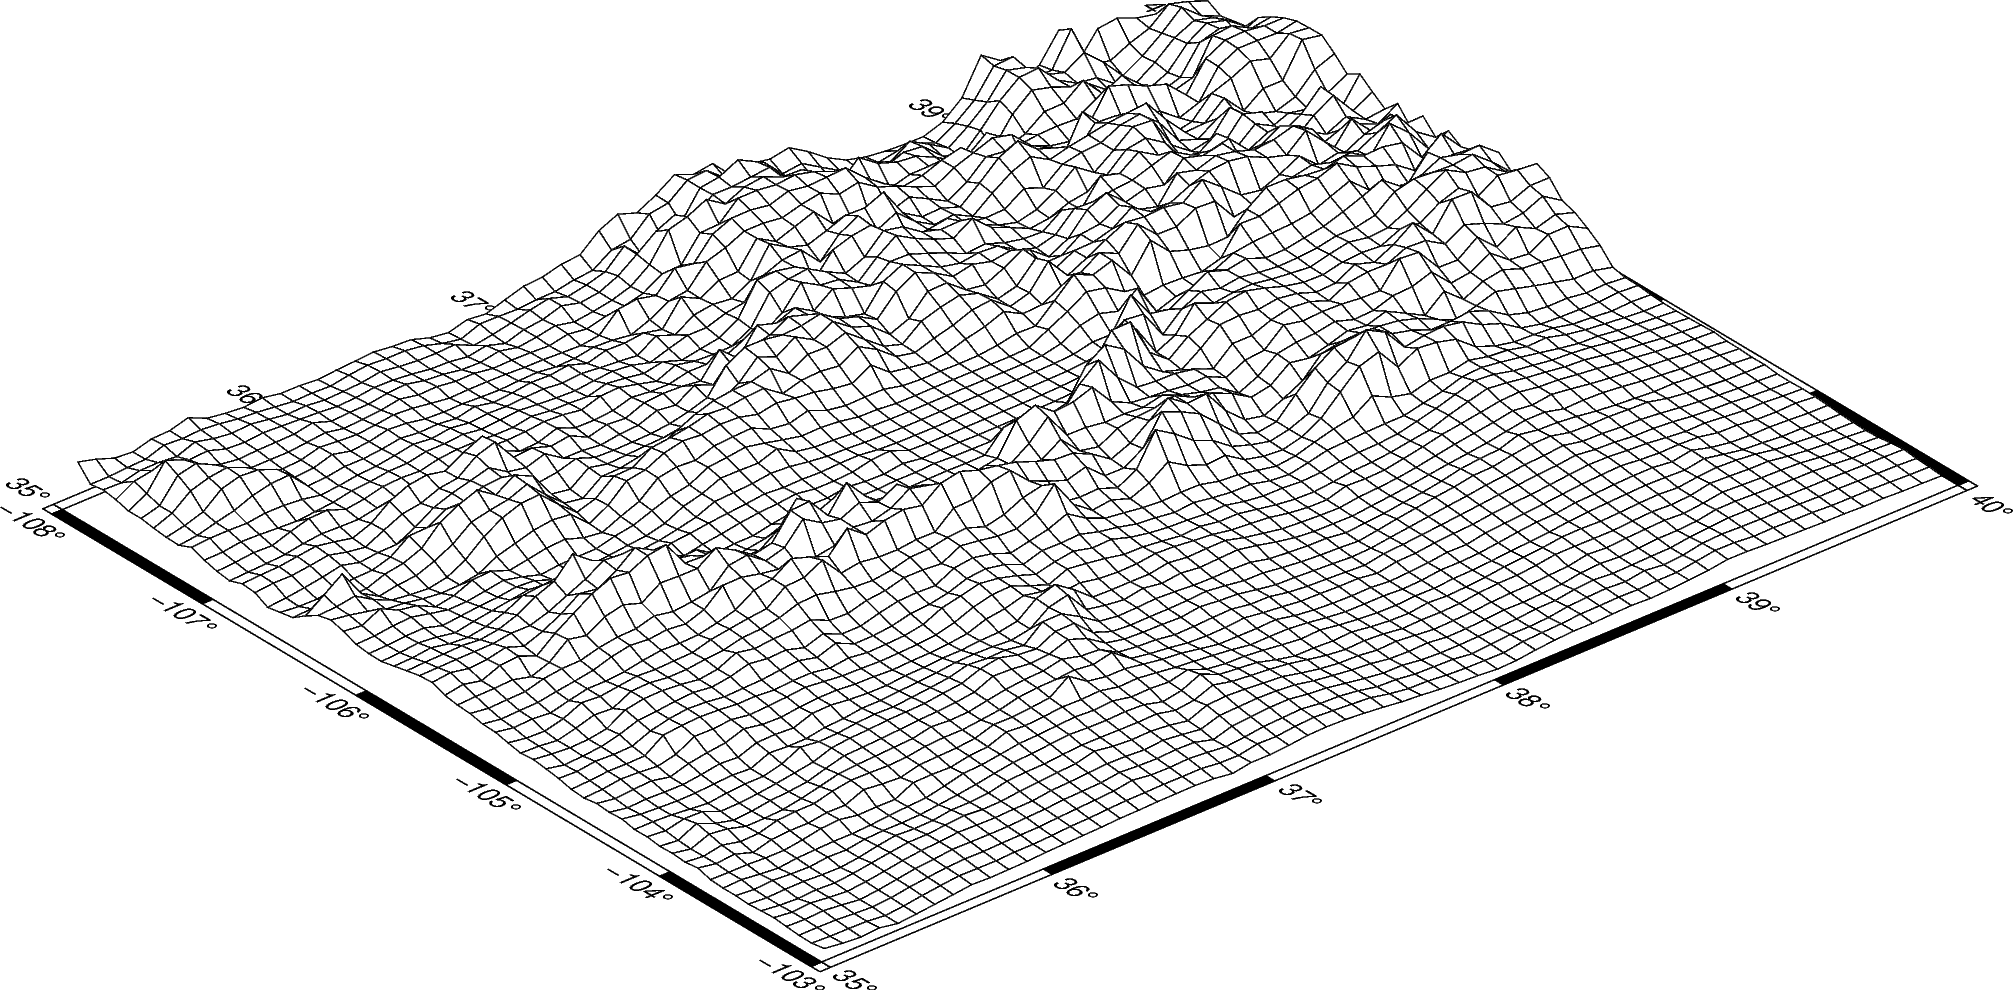
The pygmt.Figure.grdview method takes the grid input.
The perspective argument changes the azimuth and elevation of the viewpoint; the
default is [180, 90], which is looking directly down on the figure and north is “up”.
The zsize argument sets how tall the three-dimensional portion appears.
The default grid surface type is mesh plot.
fig = pygmt.Figure()
fig.grdview(
    grid=grid,
    # Sets the view azimuth as 130 degrees, and the view elevation as 30 degrees
    perspective=[130, 30],
    # Sets the x- and y-axis labels, and annotates the west, south, and east axes
    frame=["xa", "ya", "WSnE"],
    # Sets a Mercator projection on a 15-centimeter figure
    projection="M15c",
    # Sets the height of the three-dimensional relief at 1.5 centimeters
    zsize="1.5c",
)
fig.show()
Out:
<IPython.core.display.Image object>
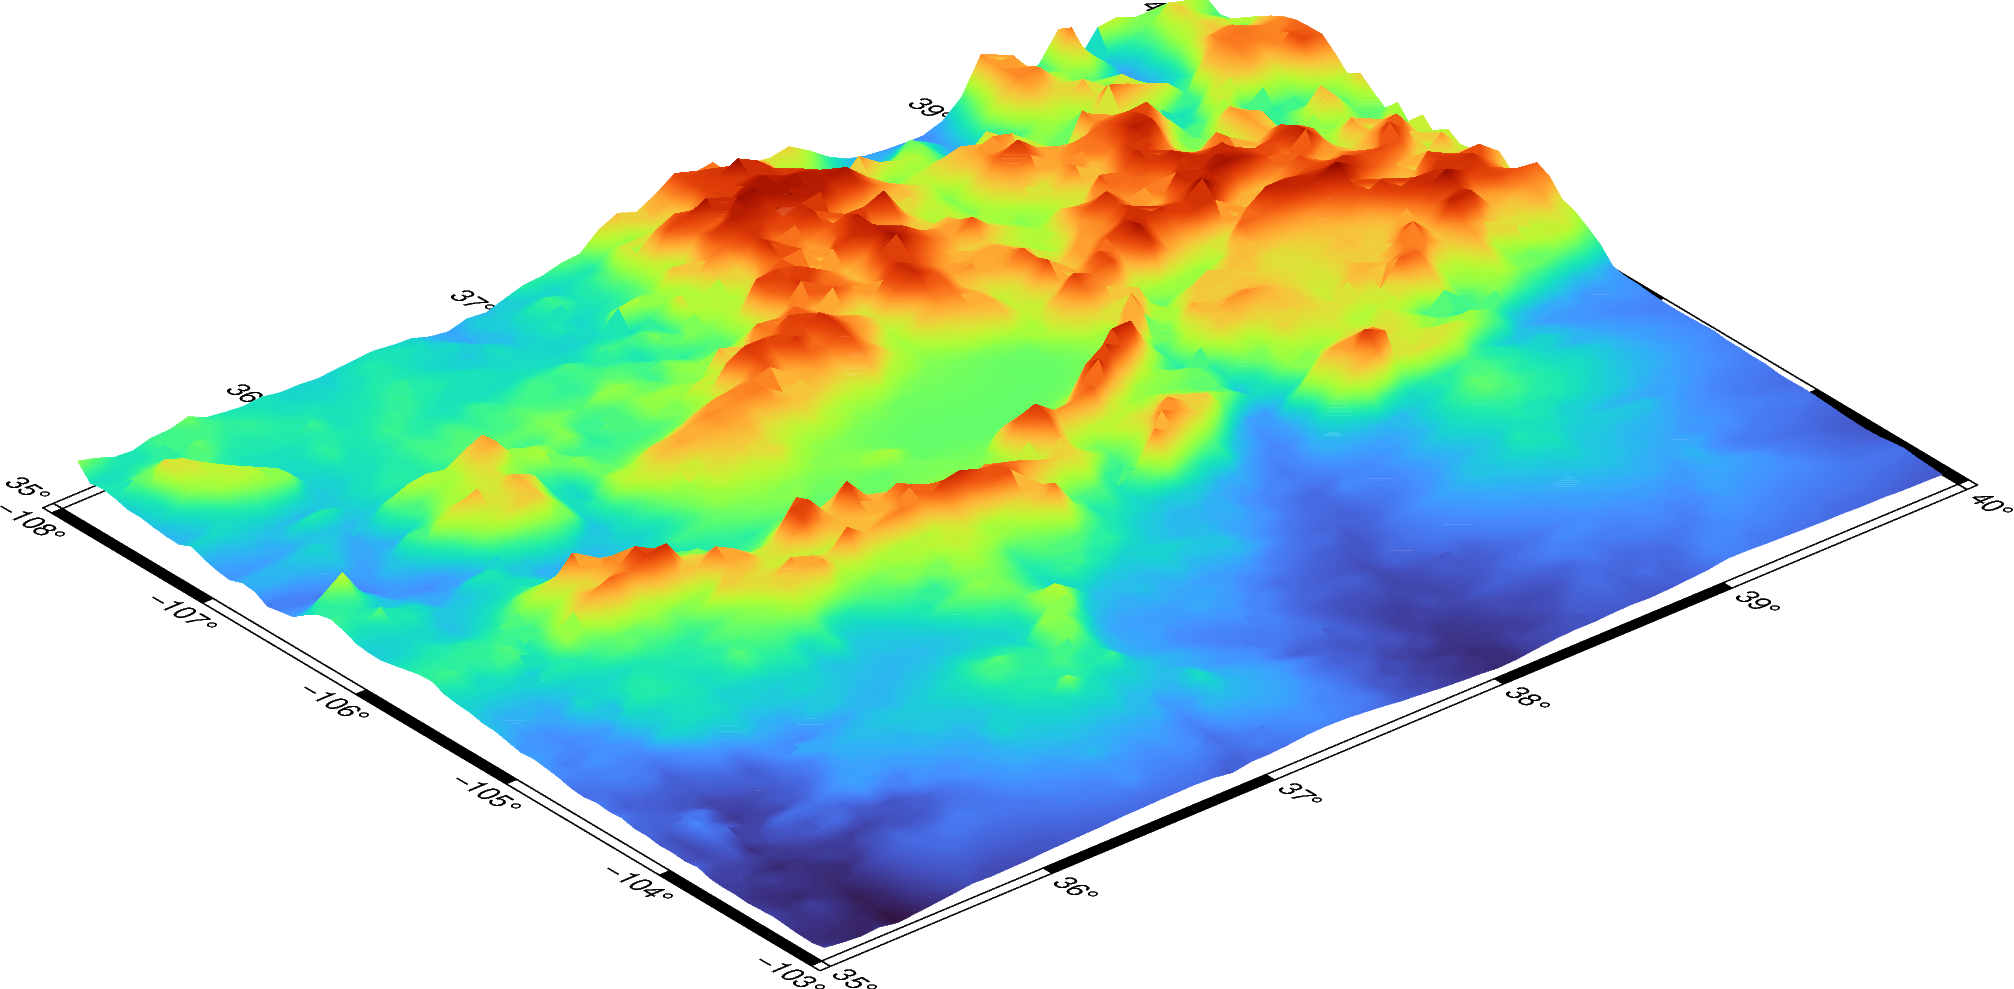
The grid surface type can be set with the surftype parameter.
fig = pygmt.Figure()
fig.grdview(
    grid=grid,
    perspective=[130, 30],
    frame=["xa", "ya", "WSnE"],
    projection="M15c",
    zsize="1.5c",
    # Set the surftype to "surface"
    surftype="s",
)
fig.show()
Out:
<IPython.core.display.Image object>
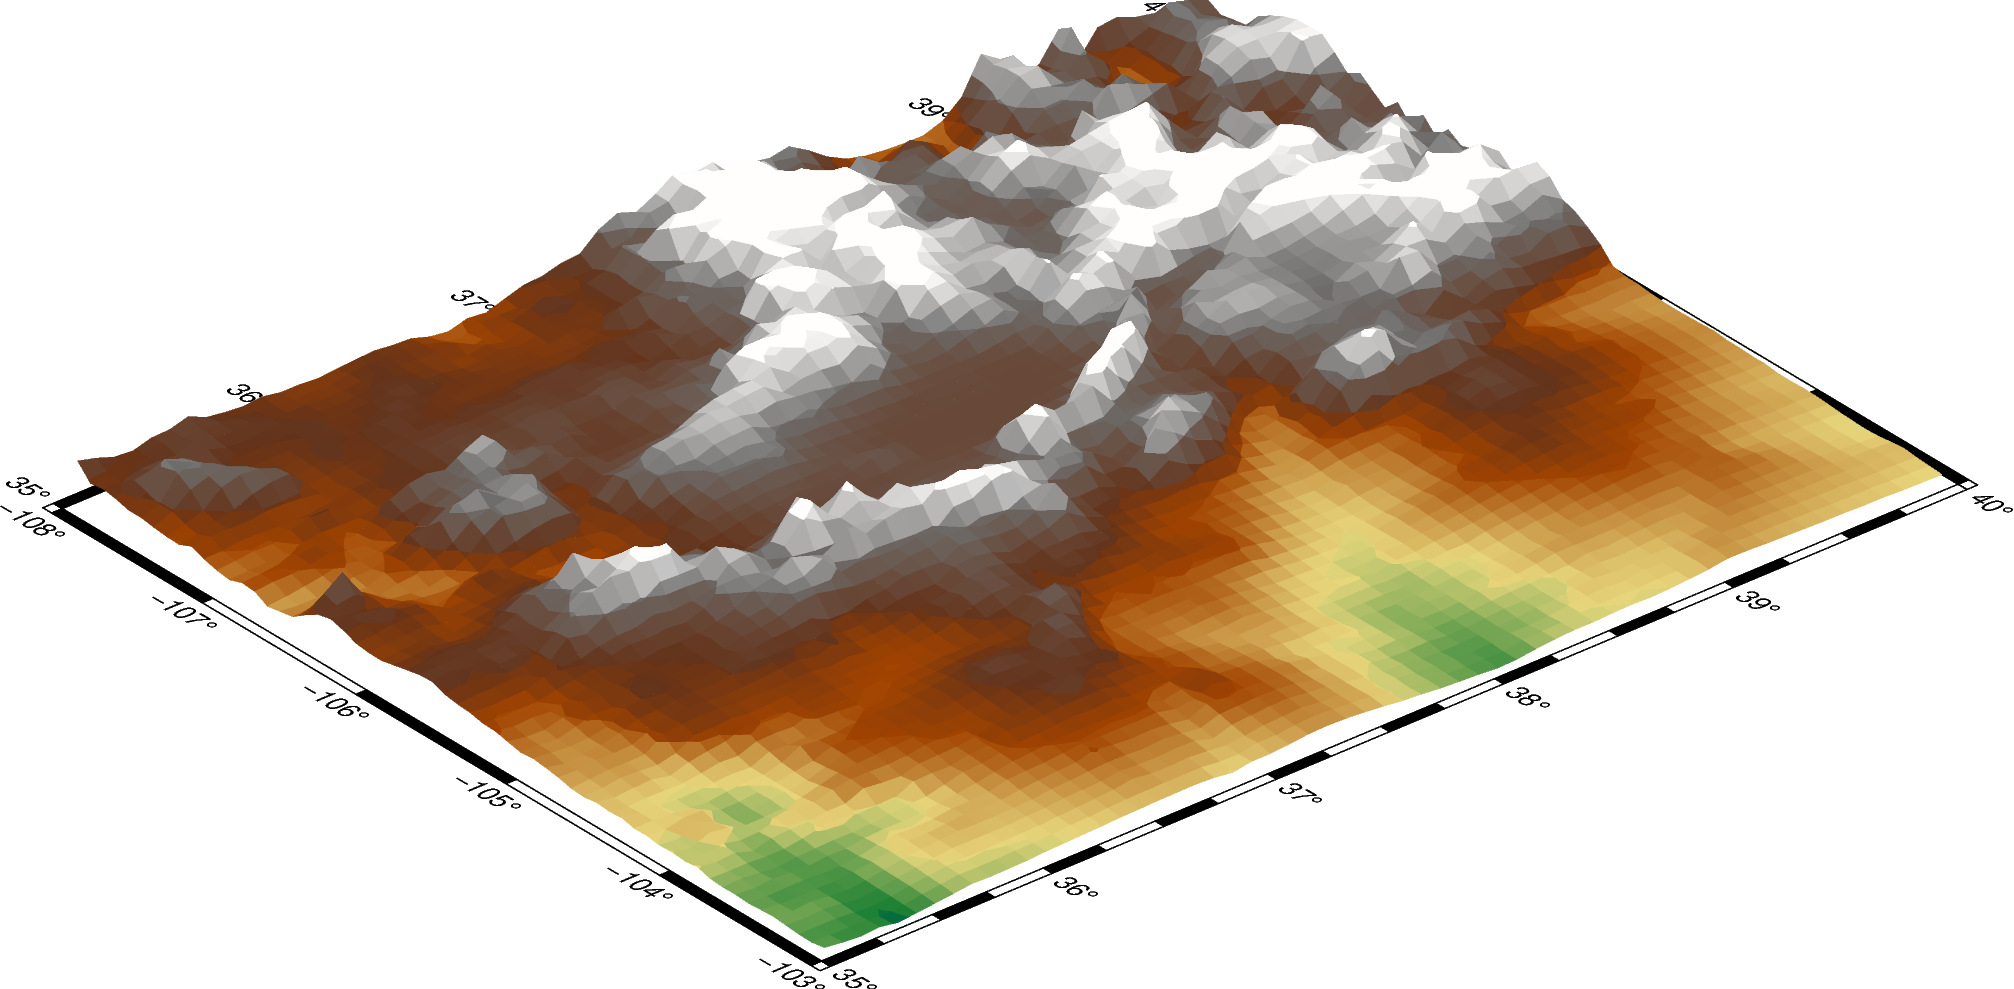
The default CPT is turbo and can be customized with the cmap parameter.
fig = pygmt.Figure()
fig.grdview(
    grid=grid,
    perspective=[130, 30],
    frame=["xa", "yaf", "WSnE"],
    projection="M15c",
    zsize="1.5c",
    surftype="s",
    # Set the CPT to "geo"
    cmap="geo",
)
fig.show()
Out:
<IPython.core.display.Image object>
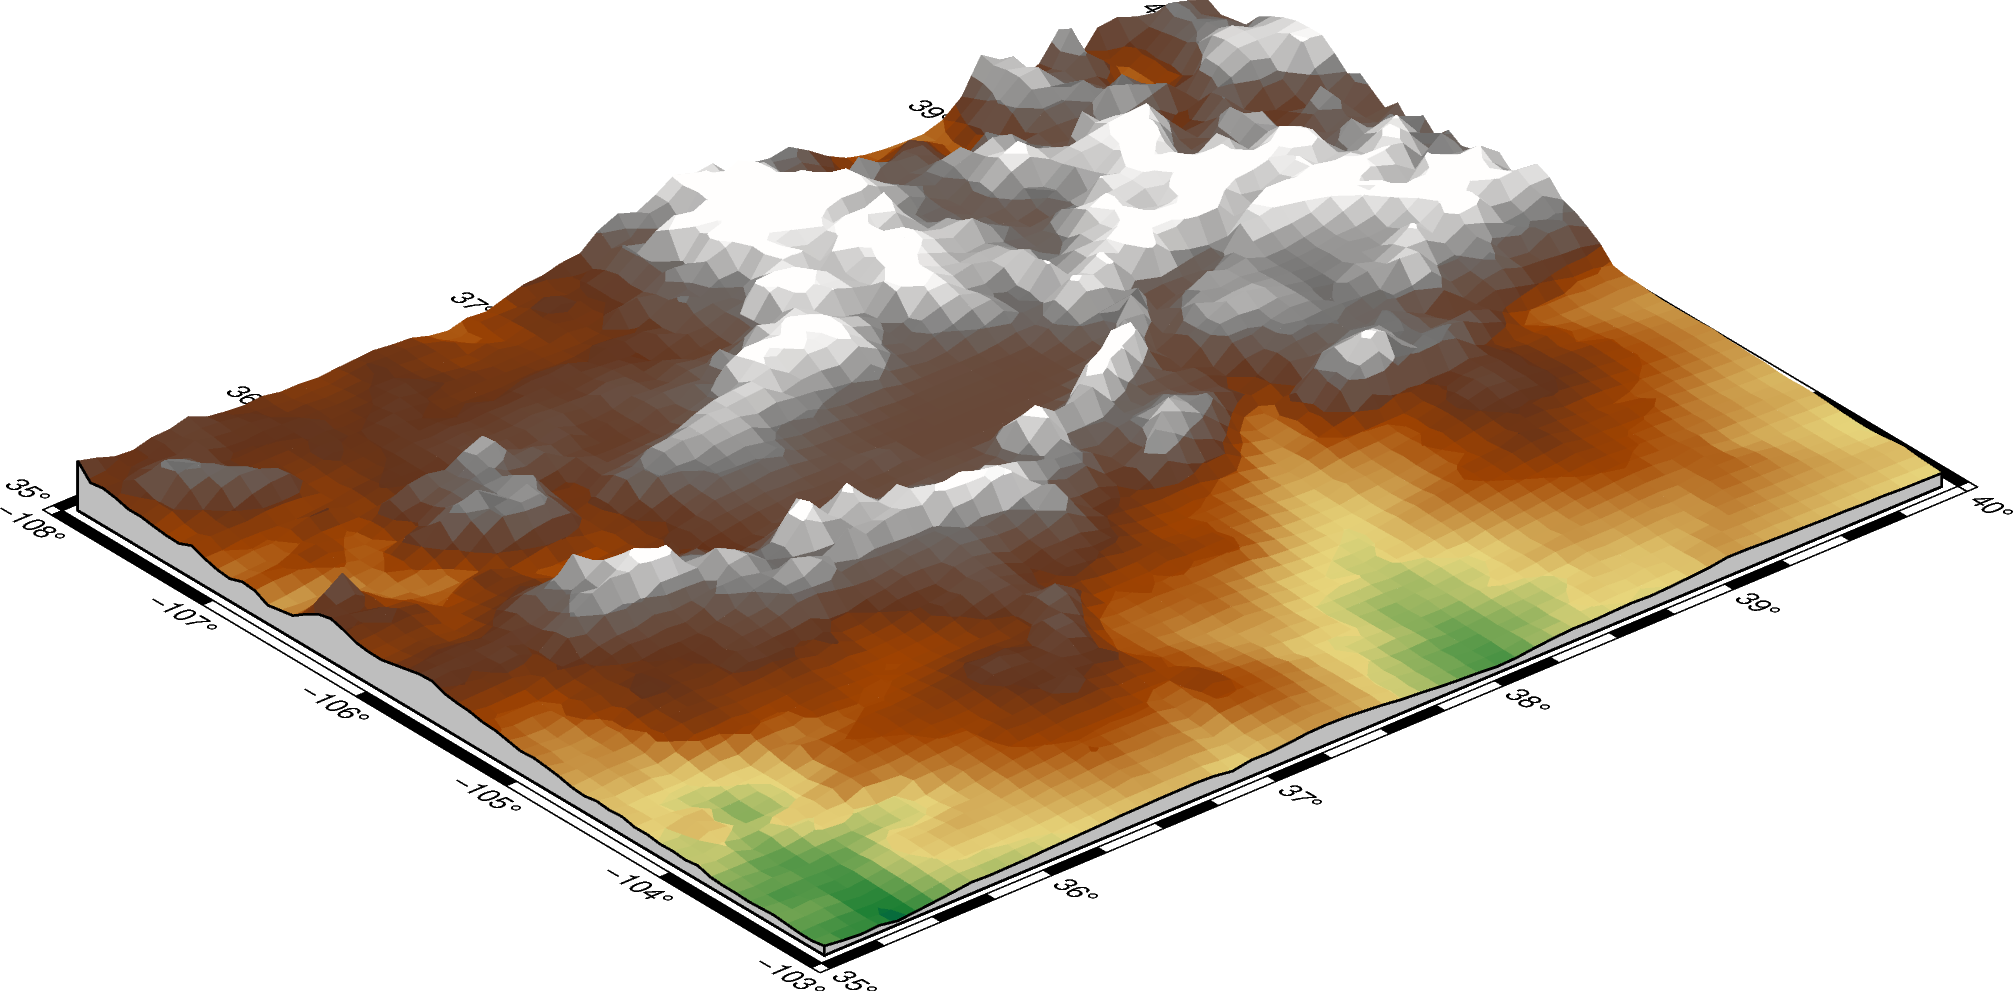
The plane argument sets the elevation and color of a plane that provides a fill
below the surface relief.
fig = pygmt.Figure()
fig.grdview(
    grid=grid,
    perspective=[130, 30],
    frame=["xa", "yaf", "WSnE"],
    projection="M15c",
    zsize="1.5c",
    surftype="s",
    cmap="geo",
    # Set the plane elevation to 1,000 meters and make the fill "gray"
    plane="1000+ggray",
)
fig.show()
Out:
<IPython.core.display.Image object>
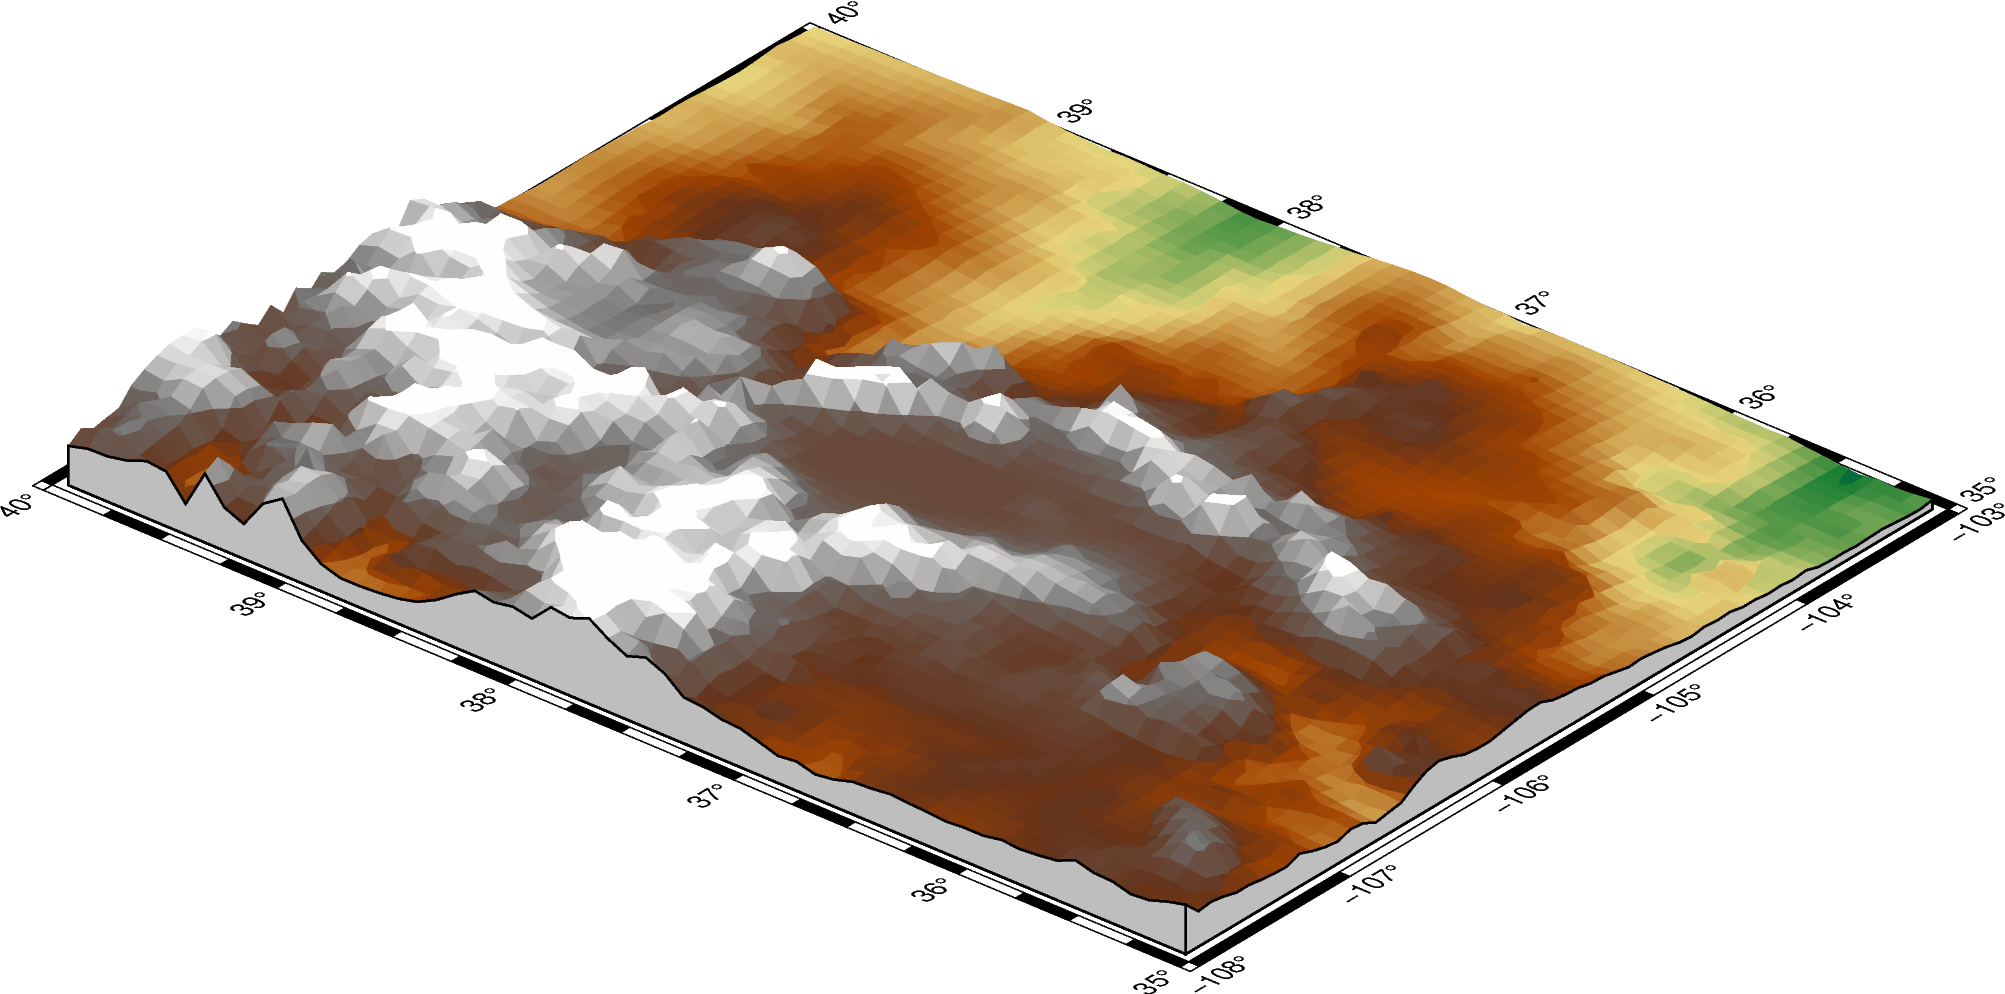
The perspective azimuth can be changed to set the direction that is “up”
in the figure.
fig = pygmt.Figure()
fig.grdview(
    grid=grid,
    # Set the azimuth to -130 (230) degrees and the elevation to 30 degrees
    perspective=[-130, 30],
    frame=["xa", "yaf", "WSnE"],
    projection="M15c",
    zsize="1.5c",
    surftype="s",
    cmap="geo",
    plane="1000+ggrey",
)
fig.show()
Out:
<IPython.core.display.Image object>
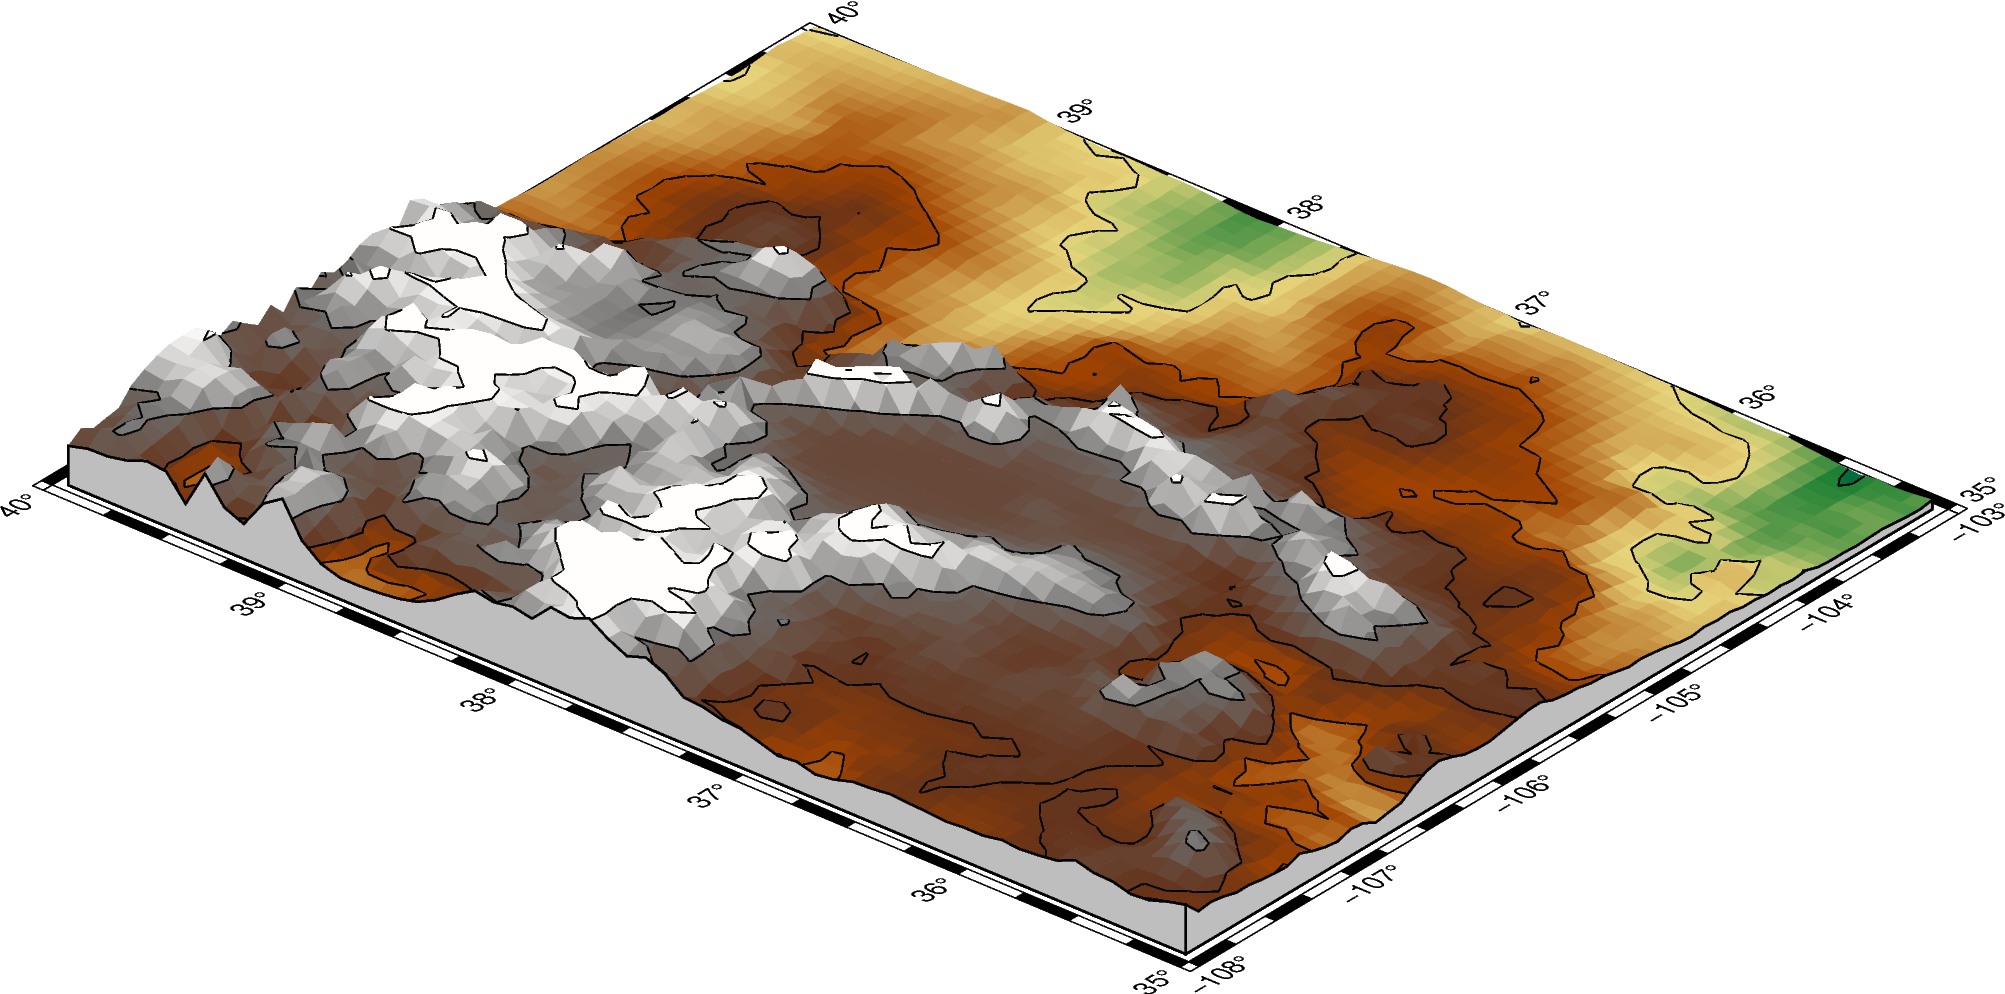
The contourpen parameter sets the pen used to draw contour lines on the surface.
fig = pygmt.Figure()
fig.grdview(
    grid=grid,
    perspective=[-130, 30],
    frame=["xaf", "yaf", "WSnE"],
    projection="M15c",
    zsize="1.5c",
    surftype="s",
    cmap="geo",
    plane="1000+ggrey",
    # Set the contour pen thickness to "0.5p"
    contourpen="0.5p",
)
fig.show()
Out:
<IPython.core.display.Image object>
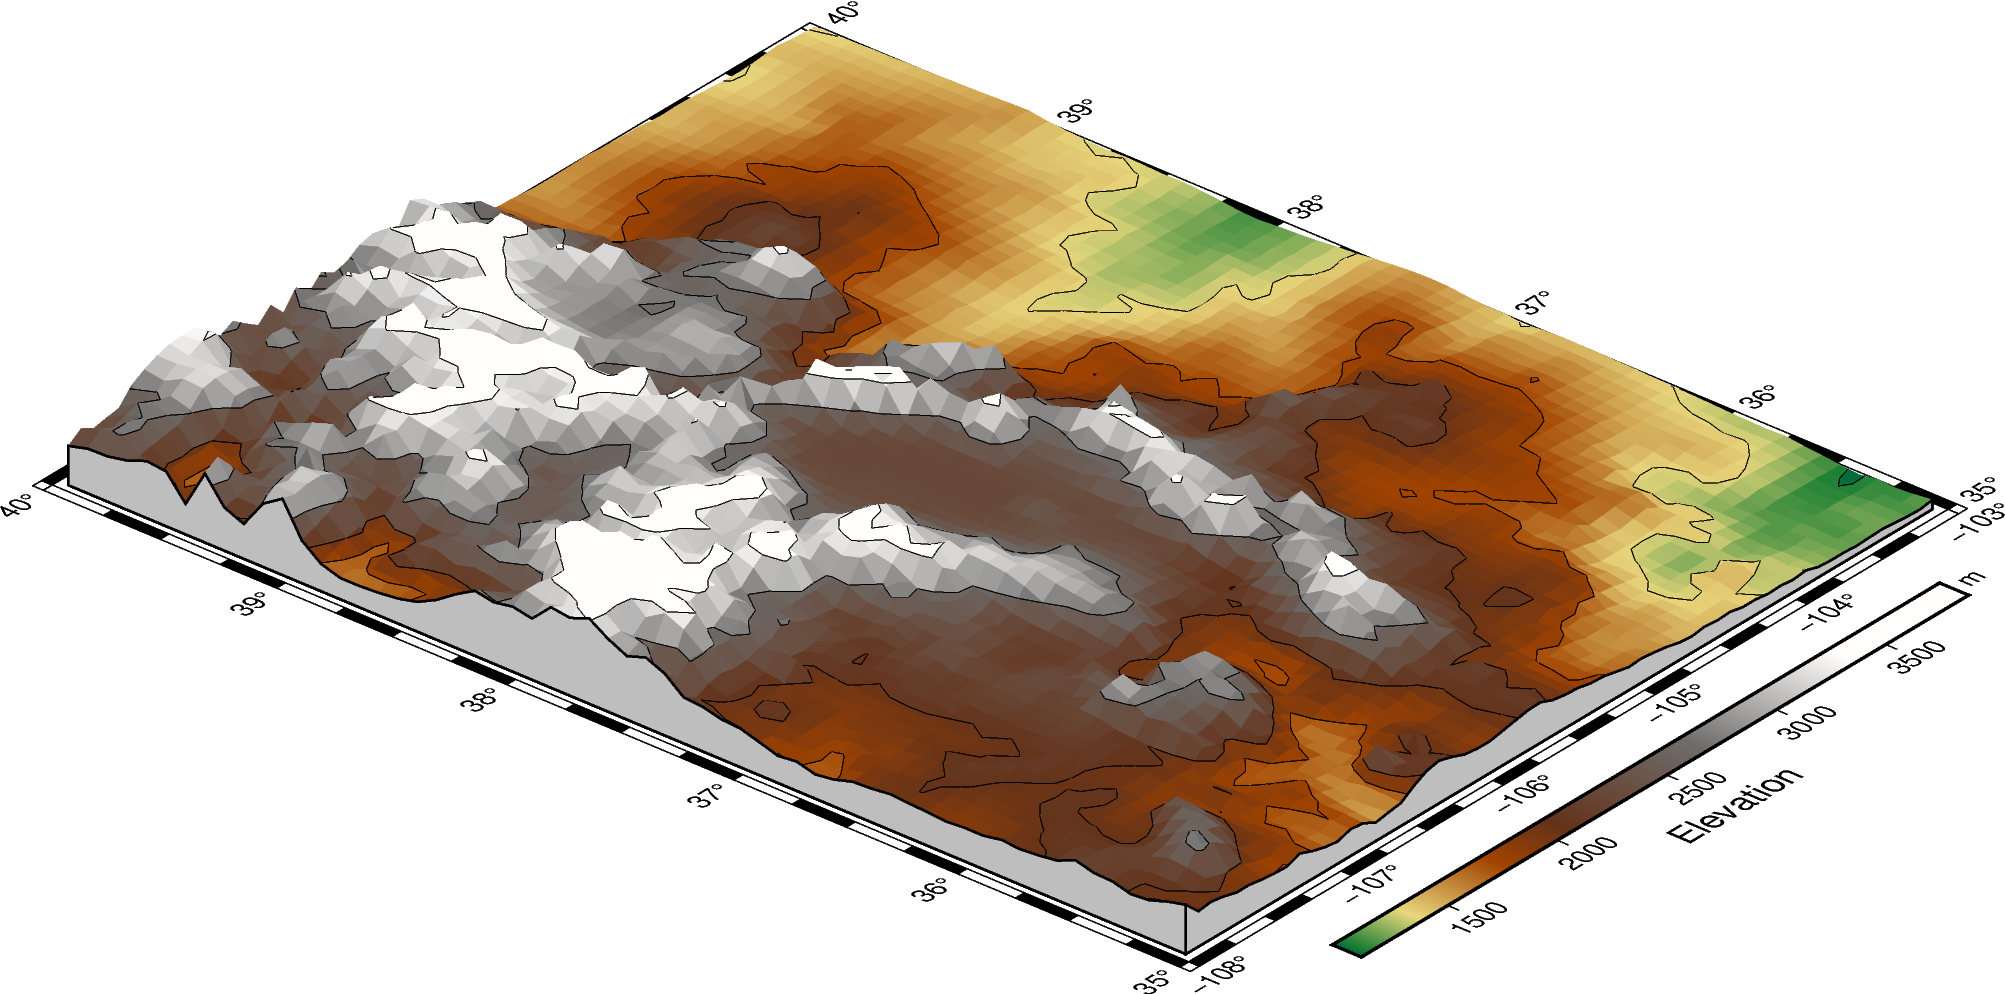
pygmt.Figure.colorbar can be used to add a color bar to the figure. The
cmap argument does not need to be passed again. To keep the color bar’s alignment
similar to the figure, use True as the perspective argument.
fig = pygmt.Figure()
fig.grdview(
    grid=grid,
    perspective=[-130, 30],
    frame=["xaf", "yaf", "WSnE"],
    projection="M15c",
    zsize="1.5c",
    surftype="s",
    cmap="geo",
    plane="1000+ggrey",
    contourpen="0.1p",
)
fig.colorbar(perspective=True, frame=["a500", "x+lElevation", "y+lm"])
fig.show()
Out:
<IPython.core.display.Image object>
Total running time of the script: ( 0 minutes 19.731 seconds)